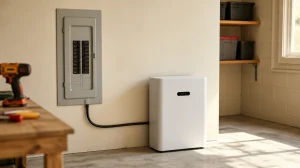
A LiFePO4 home battery lifespan runs 10 to 15 years under normal home use. An NMC or NCA unit reaches its end threshold sooner at the same daily depth. The pace-setter is not the year count. It is the cycles to 80% capacity, and the warranty shows how much of that number the maker stands behind.
This guide compares the chemistries on cycle data. It explains what the 80% end-of-life threshold means, and it shows how to turn a cycle rating into a year count for your usage. Cycle math is where most buyers get misled, so every example below works from a published rating. Start with our LiFePO4 cycle life page for the unit-level detail, or the LFP vs NMC comparison for the chemistry head-to-head.
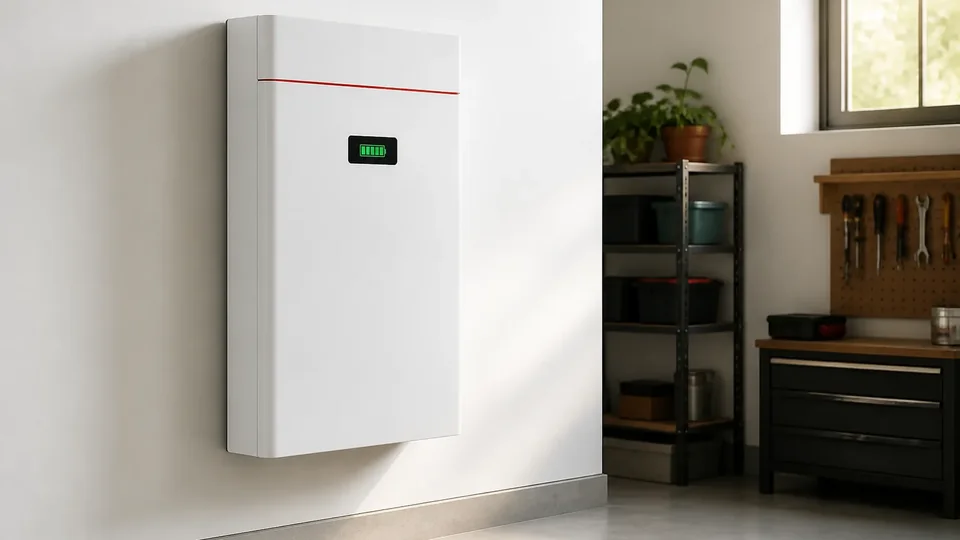
How Long Does a Home Battery Lifespan Really Run?
The honest answer comes in cycles, not years. A battery ages on two clocks. Every full charge and discharge is one cycle, and calendar time adds its own fade. When both run, the pack does not stop, it just gets thinner. Because of that, a 15-year claim without a cycle number is marketing, not engineering.
The table below puts the three main chemistries side by side. It compares cycles to 80% capacity, the number most makers rate. It also shows the years that implies at about one full cycle per day. The LFP row anchors on a 25°C rating, since temperature sets the pace of fade.
| Chemistry | Cycles to 80% (rated) | Years at ~1 cycle/day | Typical warranty |
|---|---|---|---|
| LiFePO4 (LFP) | 4000-8000+, at 25°C | 10-15, calendar-limited | 5-10 years, varies by brand |
| NMC | 1500-3000, at 25°C | 4-8 | 5-10 years, varies by brand |
| NCA | 1000-1500, published test data | 3-5 | 5-10 years, varies by brand |
Read the table one way first: LFP out-cycles the nickel chemistries by several times. In other words, one LFP stack can run where two or three NMC packs would fade, over the same lifespan in service. In practice, that gap is the main reason the residential market moved to LFP. The NCA range traces to an open-access DLR ageing study (DLR battery ageing data). That study cycled full packs down to the 80% line.
What Does 80% Capacity Actually Mean?
Every cycle rating in the table stops at 80% of fresh capacity. The reason is a convention, not a defect. Read it as an aging line, not a usage limit. A new pack delivers 100% of its rated capacity, and you keep using it all until the pack ages down. International test standards, such as IEC 62619, set the line. They call end of life the point where the pack can no longer hold 80% of its rated capacity. That threshold is where the published home battery lifespan ends, even though the pack keeps working. The certification side of the convention sits on our home battery certifications page.
Why 80%, and not 0% or 100%?
Why not count 100%? A fresh pack starts at 100%, so that point marks the beginning of life, not the end. Why not wait for 0%? Because a real pack rarely fades all the way to 0%. Once it drops below 80%, the same daily load runs it deeper, and a deeper depth ages it faster. So the industry stops the lifespan clock at 80%, and warranties follow the same line. At that point you still hold a useful battery. For instance, a 10 kWh pack then still stores about 8 kWh. The 80% line is where the economics turn, long before the hardware fails. The capacity side of the same math is in our home battery capacity guide.
How to Turn a Cycle Rating Into Years
RUIDASIMAI is a residential home battery manufacturer. So the LFP reference below uses our published 6000 to 8000 cycle ratings at 25°C, across the 5, 10 and 16 kWh steps. The math itself has three inputs: the rated cycles, your daily discharge as a share of capacity, and the calendar fade floor.
For example, take a 10 kWh pack that discharges 7 kWh per day. That is 0.7 cycles a day. At 8000 rated cycles, the math reaches 31 years on cycle count alone. The calendar clock, however, usually sets the real end point in a garage at 25°C. Work your own number the same way. First, take the worst-month daily discharge from the bill or the inverter log. Second, divide it by the pack capacity. Third, divide the rated cycles by that daily fraction. When the result lands past 10 years, trust the warranty window more. The maker has staked its name on the years.
What the Warranty Tells You
A warranty converts a cycle rating into a commitment you can enforce. Ours is 5 years, and the home battery warranty guide walks the terms. The warranty is the number a buyer can hold the maker to, so read it for three lines. These are the capacity guarantee at year 5, the defect coverage, and the conditions that void it.
Some factories offer 10 or 15 years of cycles, but only 3 years of warranty. The gap is the risk you carry. In that case, ask for the capacity-at-year-5 projection in writing. The best home batteries of 2026 table pairs each cycle rating with its warranty. That lets you see the gap at a glance.
How to Stretch the Lifespan
Three levers matter more than the rest. First, keep the daily depth moderate. A shallow cycle ages less than a deep one at the same count. Second, control temperature. Fade accelerates in heat, and a cool, ventilated spot slows it. Third, let the BMS do its job. The balance and thermal logic is what keeps a 16S1P pack even. When all three hold, the published lifespan rating becomes a floor rather than a ceiling.
Frequently Asked Questions
How many years does a 10 kWh home battery last?
On cycle math, a 10 kWh LFP pack rated at 8000 cycles runs past 10 years at one cycle a day. Calendar fade usually sets the practical end before that. In a home with one to two cycles a day, plan on 10 to 15 years before the pack drops below the 80% line.
Do I only get 80% of the capacity I pay for?
No. The 80% line is an end-of-life marker, not a usage limit. You get the full rated capacity from day one, for the whole battery life you buy. The BMS manages the charge range on its own. Only when the pack ages down to 80% does the industry call it end of life. Until then, the hours you plan on are the hours you get across all those years.
Does a home battery lose capacity if it sits unused?
Yes, a little. Calendar fade runs even at rest, because the chemistry ages with time and temperature. Store the pack near 50% state of charge in a cool place, and the rest fade stays low over the years. That is why the BMS manages the idle point on its own.
What happens when the battery reaches 80% capacity?
Nothing dramatic. The pack still charges and discharges, and the BMS keeps it in the safe range. What changes is the plan. The remaining margin grows thinner, the daily load runs deeper, and the economics of a replacement start to show in the payback math.
Is 25°C the only condition that matters for cycle data?
No, it is the reference point. Ratings carry a 25°C label, since that is the lab standard. A hotter garage ages the pack faster than the number implies. When you compare packs, keep the temperature and the depth of discharge from the same row, since both move the cycle count.
Which lasts longer, an LFP pack or a premium NMC wall unit?
On cycles, the LFP pack wins. Ours rate at 6000 to 8000 at 25°C, against typically 1500 to 3000 for NMC. The NMC unit also fades faster in heat, so the gap widens in warm climates. The head-to-head, including energy density and cost per kWh, sits in our LFP vs NMC guide.
Do partial discharges count as full cycles?
They add up fractionally. Five 0.2 cycles equal one full cycle, since wear scales with the charge moved. Your inverter log shows the daily discharge. The weekly total divided by the pack capacity is the real cycle rate, and it sets the years you can expect.
Bottom Line
Overall, a home battery lifespan is a cycle number wearing a years costume. Check the chemistry first, since LFP out-cycles nickel by several times. Then read the 80% threshold as the economic line, not the failure line. Work your daily discharge through the three-step math above. Hold the warranty to the year count it actually guarantees. The sizing guide covers the load side of the same calculation. Our home battery sizing guide runs the numbers from your appliances back to the capacity.
Warranty support
Want your cycle math checked against your use?
Send us your daily cycle depth and climate. We project capacity at year 5 and year 10 and confirm the warranty terms that protect your numbers.
- Typical daily discharge depth
- Where the battery will be installed
- Target lifetime in years or cycles
Prefer email? Write to admin@rdsmod.com